What is included in the Tuisku strategies?

The strategies are written in Pine Script, 100% adaptable to Tradingview
Features of Tuisku Trading Strategies

  1. Decision Trees: The system decides to Buy, Sell, or Hold using machine learning based on key indicators like RSI and moving averages.
  2. Technical Patterns: Offers 40 popular trading patterns from TradingView for thorough market analysis.
  3. Candle Timeframe Validation: Ensures the correct timeframe is used. 
  4. Take Profit and Stop Loss: Automatically sets profit and loss levels to manage risk and lock in gains.
  5. Position Sizing: Default investment is $10,000 usd, automatically adjusted based on the current price.
  6. Trading Execution: Executes buy and sell orders while managing risk and optimizing profits.

Step-by-Step Wiki: How Tuisku Trading Strategies Work on TradingView

Video Explanation:

Tuisku provides a diverse range of technical patterns, each with its own decision tree to support trading strategies.
All these patterns are inspired by some of the most popular indicators available on TradingView. 
Tuisku features 40 distinct technical patterns, including strategies based on RSI, Ichimoku, MACD, and more.The logic and calculations for these patterns within Tuisku strategies are captured in the code. 

Summarized between the lines: 

     // CODE associated with the technical indicator
     // EXPLANATION OF THE STRATEGY.

Technical Patterns from TraderView

Can't find the indicator you're looking for? 
Email us at sales@tuisku.eu

to request an AI-optimized strategy tailored to your needs.
with the associated Pine Script and we will return the strategy to you

View Full List of Technical Patterns
                             // CODE associated with the technical indicator Bollinger_RSI_Double_Strategy
//@version=5
RSIlength = input.int(6, title="RSI Period Length")
BBlength = input.int(200, minval=1, title="Bollinger Period Length")
BBbasis = ta.sma(close, BBlength)
BBupper = BBbasis + (2 * ta.stdev(close, BBlength))
BBlower = BBbasis - (2 * ta.stdev(close, BBlength))
buyEntry = ta.crossover(close, BBlower)
sellEntry = ta.crossunder(close, BBupper)
plot(BBbasis, color=color.aqua, title="Bollinger Bands SMA Basis Line")
// EXPLANATION OF THE STRATEGY
//The provided Pine Script implements a trading strategy that includes stop loss (SL) and multiple take profit (TP) levels, 
                          

Candle Timeframe Validation

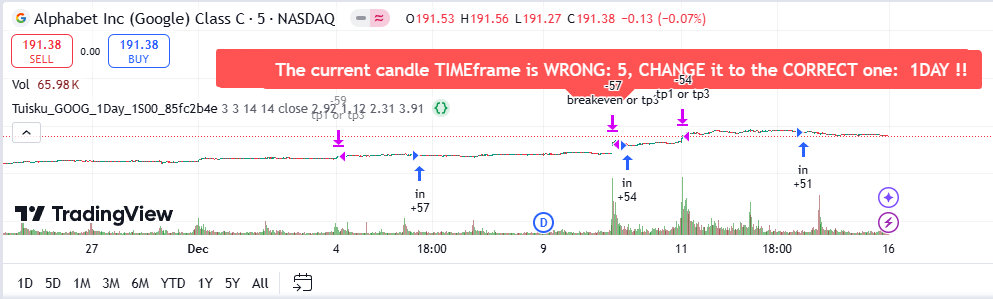
Candle Timeframe Validation This code ensures the strategy or indicator is applied only on the correct timeframe by verifying if the chart's current timeframe matches the expected "1Day" period; if not, a red label appears on the chart with a message suggesting,

"The current candle TIMEframe is WRONG:  5Min, CHANGE it to the CORRECT one: 1DAY !!" and an alert is triggered.
Available Timeframes: 1Min, 5Min, 15Min, 30Min, 1Hour, 1Day.

// Define expected timeframe based on the selected interval: 1Day pine_value: D   Trigger an alert and show a label if the timeframe is incorrect

               // EXPLANATION OF THE STRATEGY
//The provided Pine Script implements a trading strategy that includes stop loss (SL) and multiple take profit (TP) levels,
//with an option to activate a trailing stop at the third TP level. Here's a detailed breakdown of its components and functionality:
//Variables Initialization:
var float stop = na
var float limit1 = na
var float limit2 = na
// Converts a percentage to points based on the average position price and the minimum tick size.
percent2points(percent) =>
    strategy.position_avg_price * percent / 100 / syminfo.mintick
// Stop Loss and Take Profit Inputs:
//Defines inputs for stop loss and three take profit levels in percentage terms.
sl = percent2points(input(2.92, title="stop loss %%"))
tp1 = percent2points(input(1.12, title="take profit 1 %%"))
tp2 = percent2points(input(2.31, title="take profit 2 %%"))
tp3 = percent2points(input(3.91, title="take profit 3 %%"))
activateTrailingOnThirdStep = input(false,title="activate trailing on third stage (tp3 is amount, tp2 is offset level)")
log.info("Stop Loss (sl):", sl," Take Profit 1 (tp1):", tp1, " Take Profit 2 (tp2):", tp2," Take Profit 3 (tp3):", tp3)
// Current Profit Calculation:
//Calculates the current profit in points based on the position size and price.
curProfitInPts() =>
    if strategy.position_size > 0
        (high - strategy.position_avg_price) / syminfo.mintick
    else if strategy.position_size < 0
        (strategy.position_avg_price - low) / syminfo.mintick
    else
        0
// Stop Loss and Profit Target Price Calculations:
//Determines the stop loss and profit target prices based on the position size and offset points.
calcStopLossPrice(OffsetPts) =>
    if strategy.position_size > 0
        strategy.position_avg_price - OffsetPts * syminfo.mintick
    else if strategy.position_size < 0
        strategy.position_avg_price + OffsetPts * syminfo.mintick
    else
        0
calcProfitTrgtPrice(OffsetPts) =>
    calcStopLossPrice(-OffsetPts)
// Current Stage Determination:
//Determines the current stage of the trade based on the profit points reached.
getCurrentStage() =>
    var stage = 0
    if strategy.position_size == 0
        stage := 0
    if stage == 0 and strategy.position_size != 0
        stage := 1
    else if stage == 1 and curProfitInPts() >= tp1
        stage := 2
    else if stage == 2 and curProfitInPts() >= tp2
        stage := 3
    stage
stopLevel = -1.
profitLevel = calcProfitTrgtPrice(tp3)
log.info("Stop Level:", stopLevel)
log.info("Profit Level:", profitLevel) 
            

Understanding Tuisku Technical Indicators: A Complete Table

Can't find the indicator you're looking for? 
Email us at sales@tuisku.eu

to request an AI-optimized strategy tailored to your needs.
with the associated Pine Script and we will return the strategy to you

Full Indicator Key Explanation Traderview URL Indicator
ADX and DI (Average Directional Index and Directional Indicators) 1ADX The ADX (Average Directional Index) and DI (Directional Indicators) measure the strength and direction of atrend. ADX showstrendstrength, while DI+ and DI- indicate trend direction. It's used to determine whether a market istrending or ranging. www.tradingview.com/...
Bollinger RSI Double Strategy 1BOL The Bollinger RSI Double Strategy combines Bollinger Bands and the RSI (Relative Strength Index) to identify potential trend reversals and market conditions. Bollinger Bands are used to measure volatility, while the RSI identifies overbought and oversold conditions. This strategy generates signals based on both volatility and momentum, providing more reliable trading opportunities. www.tradingview.com/...
Blai5 Koncorde v10 1KON Koncorde is a technical indicator that helps to analyze markettrends by showing the interaction between volume, price movement, and the behavior of different market participants. It combines various factors such as buying/selling pressure, volume, and price to generate trading signals. es.tradingview.com/s...
TMA Overlay (Triangular Moving Average) 1TMA The TMA (Triangular Moving Average) Overlay is a ​ technical indicator that smooths price data to identify markettrends. It helps to visualize the overall market direction by averaging price movements. Upper and lower bands are used to highlight potential overbought or oversold conditions. www.tradingview.com/...
WaveTrend Oscillator (WT) 1WAV The WaveTrend Oscillator (WT) is a momentum-based oscillator that helps identify market reversals and trends trengths. It generates buy/sell signals by comparing the market's momentum with predefined overbought and oversold levels, making it useful for timing entries and exits in trading. www.tradingview.com/...
Ichimoku Oscillator 1ICH The Ichimoku Oscillator is a comprehensive technical indicator that shows support, resistance,trend direction, and momentum. It consists of five lines: Tenkan-sen, Kijun-sen, Senkou Span A, Senkou Span B, and Chikou Span, which provide insight into potential future price movements,trendstrength, and reversals. www.tradingview.com/...
Fibonacci Bollinger Bands (FBB) 1FIB The FibonacciBollinger Bands (FBB) is a technical analysis tool that combines Fibonacci levels with Bollinger Bands. It uses Fibonacci ratios to adjust the width of the Bollinger Bands, providing better insights into price volatility and potential reversal points. Traders use it to identify overbought or oversold market conditions. www.tradingview.com/...
CM Williams Vix Fix V3 Ultimate 1WIL The CM Williams Vix Fix is a volatility indicator that identifies potential market bottoms by mimicking the VIX (Volatility Index). It provides a reliable signal of high volatility periods, indicating potential reversal points and opportunities to buy during market lows. www.tradingview.com/...
CM Ultimate MA MTF V2 1ULT The CM Ultimate MA MTF V2 is a multi-timeframe moving averageindicatorthat calculates and displays moving averages from multiple timeframes on a single chart. It helps traders identifytrends and potential reversals by combining short-term and long-term moving averages for more accurate signals. www.tradingview.com/...
Squeeze Momentum Indicator (LazyBear) 1SQU The Squeeze Momentum Indicator by LazyBear combines Bollinger Bands and Keltner Channels to identify potential breakout points. It detects periods of low volatility (squeeze) where a breakout is likely to happen. The momentum oscillator then provides insight into the direction of the potential breakout. www.tradingview.com/...
Candlestick Patterns Identified 1CAN The Candlestick Patterns Identified indicator detects common candlestick patterns such as Doji, Engulfing, and Hammer. These patterns help traders identify potential reversals or continuations in markettrends by providing visual signals on the chart. www.tradingview.com/...
MACD Ultimate MTF 1MAC The MACD Ultimate MTF (Multi-Time Frame) is an advanced MACDindicatorthat shows the Moving Average Convergence Divergence across multiple timeframes. It helps traders identify the strength and direction of atrendby displaying the relationship between short-term and long-term moving averages, with a signal line and histogram indicating momentum shifts. www.tradingview.com/...
Madrid Moving Average Ribbon 1MAD The Madrid Moving Average Ribbon is a trend-following indicator that uses multiple moving averages to create a ribbon-like visual effect. It helps traders identifytrends and potential reversal points by analyzing the convergence and divergence of moving averages. The ribbon expands during strongtrends and contracts during periods of consolidation. es.tradingview.com/s...
Smart Money Concepts (SMC) by LuxAlgo 1SMA The Smart Money Concepts (SMC)indicatorby LuxAlgo is designed to help traders understand market structure and identify key liquidity zones. It highlights order blocks and areas where institutional traders may be placing their trades, providing a more informed view of price action and potential reversals. www.tradingview.com/...
SuperTrend by KivancOzbilgic 1SUP The SuperTrend indicatoris an ATR-based trailing stop that helps detect ongoingtrends, signaling buy/sell points based on its position relative to price. Suitable for various markets and timeframes. www.tradingview.com/...
Bull and Bear Power 1B00 The Bull and Bear Power indicator measures the balance of power between buyers and sellers by comparing price extremes to a moving average. www.tradingview.com/...
Chaikin Money Flow (CMF) 1C00 The Chaikin Money Flow (CMF) measures money flow volume over a specific period to confirm pricetrends or indicate potential reversals. www.tradingview.com/...
Money Flow Index (MFI) 1M00 The Money Flow Index (MFI) combines price and volume data to identify overbought or oversold conditions in an asset. www.tradingview.com/...
Stochastic RSI 1S00 The Stochastic RSI generates signals for overbought or oversold conditions based on the RSI formula, increasing sensitivity to price movements. www.tradingview.com/...
Triple Exponential Moving Average (TEMA) 1T00 The Triple Exponential Moving Average (TEMA) smooths price data to reduce lag in moving averages, providing faster trend reaction. www.tradingview.com/...
Vortex Indicator 1V00 The Vortex Indicator identifies the start of a newtrendby plotting two oscillating lines that measure positive and negativetrendmovements. www.tradingview.com/...
Bollinger_Bands & Bull_Bear_Power Combined 2BB0 The combined indicator of Bollinger_Bands and Bull_Bear_Power brings together: The Bollinger Bands indicator uses standard deviation bands to gauge price volatility. Additionally, The Bull and Bear Power indicator measures the balance of power between buyers and sellers by comparing price extremes to a moving average. www.tradingview.com/...
Bull_Bear_Power & Chaikin_Money_Flow Combined 2BC0 The ​combined indicator of Bull_Bear_Power and Chaikin_Money_Flow brings together: The Bull and Bear Power indicator measures the balance of power between buyers and sellers by comparing price extremes to a moving average. Additionally, The Chaikin Money Flow (CMF) measures money flow volume over a specific period to confirm pricetrends or indicate potential reversals. www.tradingview.com/...
Bull_Bear_Power & Money_Flow_Index Combined 2BM0 The ​combined indicator of Bull_Bear_Power and Money_Flow_Index brings together: The Bull and Bear Powerindicatormeasures the balance of power between buyers and sellers by comparing price extremes to a moving average. Additionally, The Money Flow Index (MFI) combines price and volume data to identify overbought or oversold conditions in an asset. www.tradingview.com/...
Bull_Bear_Power & Stochastic_RSI Combined 2BS0 The ​combined indicator of Bull_Bear_Power and Stochastic_RSI brings together: The Bull and Bear Power indicator measures the balance of power between buyers and sellers by comparing price extremes to a moving average. Additionally, The Stochastic RSI generates signals for overbought or oversold conditions based on the RSI formula, increasing sensitivity to price movements. www.tradingview.com/...
Bull_Bear_Power & Triple_EMA Combined 2BT0 The combined indicator of Bull_Bear_Power and Triple_EMA brings together: The Bull and Bear Power indicator measures the balance of power between buyers and sellers by comparing price extremes to a moving average. Additionally, The Triple Exponential Moving Average (TEMA) smooths price data to reduce lag in moving averages, providing fastertrendreaction. www.tradingview.com/...
Bull_Bear_Power & Vortex_Indicator Combined 2BV0 The ​combined indicator of Bull_Bear_Power and Vortex_Indicator brings together: The Bull and Bear Power indicator measures the balance of power between buyers and sellers by comparing price extremes to a moving average. Additionally, The Vortex Indicator identifies the start of a newtrendby plotting two oscillating lines that measure positive and negative trend movements. www.tradingview.com/...
Chaikin_Money_Flow & Money_Flow_Index Combined 2CM0 The combined indicator of Chaikin_Money_Flow and Money_Flow_Index brings together: The Chaikin Money Flow (CMF) measures money flow volume over a specific period to confirm pricetrends or indicate potential reversals. Additionally, The Money Flow Index (MFI) combines price and volume data to identify overbought or oversold conditions in an asset. www.tradingview.com/...
Chaikin_Money_Flow & Stochastic_RSI Combined 2CS0 The ​combined indicator of Chaikin_Money_Flow and Stochastic_RSI brings together: The Chaikin Money Flow (CMF) measures money flow volume over a specific period to confirm price trends or indicate potential reversals. Additionally, The Stochastic RSI generates signals for overbought or oversold conditions based on the RSI formula, increasing sensitivity to price movements. www.tradingview.com/...
Chaikin_Money_Flow & Triple_EMA Combined 2CT0 The ​combined indicator of Chaikin_Money_Flow and Triple_EMA brings together: The Chaikin Money Flow (CMF) measures money flow volume over a specific period to confirm pricetrends or indicate potential reversals. Additionally, The Triple Exponential Moving Average (TEMA) smooths price data to reduce lag in moving averages, providing fastertrendreaction. www.tradingview.com/...
Chaikin_Money_Flow & Vortex_Indicator Combined 2CV0 The ​combined indicator of Chaikin_Money_Flow and Vortex_Indicator brings together: The Chaikin Money Flow (CMF) measures money flow volume over a specific period to confirm pricetrends or indicate potential reversals. Additionally, The Vortex Indicator identifies the start of a new trend by plotting two oscillating lines that measure positive and negative trend movements. www.tradingview.com/...
MA_Cross_SMA & Money_Flow_Index Combined 2MM0 The ​combined indicator of MA_Cross_SMA and Money_Flow_Index brings together: The MA Cross with Simple Moving Average (SMA) tracks when one moving average crosses another to indicatetrendchanges. Additionally, The Money Flow Index (MFI) combines price and volume data to identify overbought or oversold conditions in an asset. www.tradingview.com/...
Money_Flow_Index & Stochastic_RSI Combined 2MS0 The ​combined indicator of Money_Flow_Index and Stochastic_RSI brings together: The Money Flow Index (MFI) combines price and volume data to identify overbought or oversold conditions in an asset. Additionally, The Stochastic RSI generates signals for overbought or oversold conditions based on the RSI formula, increasing sensitivity to price movements. www.tradingview.com/...
Money_Flow_Index & Triple_EMA Combined 2MT0 The ​combined indicator of Money_Flow_Index and Triple_EMA brings together: The Money Flow Index (MFI) combines price and volume data to identify overbought or oversold conditions in an asset. Additionally, The Triple Exponential Moving Average (TEMA) smooths price data to reduce lag in moving averages, providing faster trend reaction. www.tradingview.com/...
Money_Flow_Index & Vortex_Indicator Combined 2MV0 The ​combined indicator of Money_Flow_Index and Vortex_Indicator brings together: The Money Flow Index (MFI) combines price and volume data to identify overbought or oversold conditions in an asset. Additionally, The Vortex Indicator identifies the start of a new trendby plotting two oscillating lines that measure positive and negative trend movements. www.tradingview.com/...
Stochastic_RSI & Triple_EMA Combined 2ST0 The ​combined indicator of Stochastic_RSI and Triple_EMA brings together: The Stochastic RSI generates signals for overbought or oversold conditions based on the RSI formula, increasing sensitivity to price movements. Additionally, The Triple Exponential Moving Average (TEMA) smooths price data to reduce lag in moving averages, providing faster trend reaction. www.tradingview.com/...
Stochastic_RSI & Vortex_Indicator Combined 2SV0 The ​combined indicator of Stochastic_RSI and Vortex_Indicator brings together: The Stochastic RSI generates signals for overbought or oversold conditions based on the RSI formula, increasing sensitivity to price movements. Additionally, The Vortex Indicator identifies the start of a new trend by plotting two oscillating lines that measure positive and negative trend movements. www.tradingview.com/...
Triple_EMA & Vortex_Indicator Combined 2TV0 The ​combined indicator of Triple_EMA and Vortex_Indicator brings together: The Triple Exponential Moving Average (TEMA) smooths price data to reduce lag in moving averages, providing faster trend reaction. Additionally, The Vortex Indicator identifies the start of a new trend by plotting two oscillating lines that measure positive and negative trend movements. www.tradingview.com/...