How can tuisku help you?

Tuisku is an artificial intelligence and machine learning platform to optimize your trading strategies using technical patterns. Fully integrated with TraderView, Tuisku helps you make buying and selling decisions on assets including crypto and maximize your performance in the financial markets.

A Comparative Analysis

Tuisku RSI vs. Classic RSI

Try the pinescrip strategy, with an AI decision tree optimizing your

  1. Copy the following Code:
  2. Open TradingView.
  3. Once opened, make sure for this text that you have the candles in daily format and that the GOOG stock is on
  4. Go to the Pine Script Editor:
  5. Click the “Pine Script” button at the bottom of the TradingView interface. If the editor isn’t visible, enable it by going to the main menu > "More" > "Pine Script Editor".
  6. Copy the code below and paste it into the editor:
Open TraderView

Example of optimized mini strategy

                             if (stochasticD <= 5.85403)
    if (smoothedD_Diff > 2.31155)
        if (stochasticK <= 1.36624)
            decisionValue := 1.000000 // buy
        if (stochasticK > 1.36624)
            if (stochasticDiff <= 1.83977)
                decisionValue := 0.714286 // buy
if (stochasticD > 5.85403)
    if (stochasticD <= 16.8716)
        if (stochasticSmoothedDiff <= -2.07631)
            if (smoothedD_Diff > 12.2661)
                decisionValue := -0.750000 // sell 
                          

Classic RSI Strategy

  • Relies on fixed thresholds (e.g., RSI < 30 or > 70).
  • Totally lacking customization of the time candles and type of action
  • Lacks advanced tools, often requiring manual stop-loss and profit-taking.
  • Static thresholds with limited flexibility.

Tuisku RSI Strategy

  • Uses Random Forest AI to analyze multiple variables, putting the numbers at the optimal point. Example of buying RSI at 18.4 for Tesla and 26.4 for Google.
  • For more precise overbought/oversold signals
  • Adjustable thresholds for buy/sell signals and risk management,
  • Includes dynamic stop-loss, multi-level take-profit, and optional trailing stop.

TradingView.com Pine Script™ v5 GOOG Small icon of Alphabet  (Google) Class C - 1Day - 1S00

Open in TradingView TW icon Alphabet (Google) Class C (GOOG)

*In TW update the candles Time: - 1Day


Trading Strategy Overview

Price Name Time frame Net Profit ($) Indicators Name Net Profit (%) Closed Trades Win Rate (%) Profit Factor Max Loss ($) Max Loss (%) Avg Profit ($) Avg Profit (%)
$79.00 Alphabet (Google) Class C Icon of Alphabet (Google) Class C 1Day $9,989.17 Stochastic RSI 1.00% 59.0 55.93% 3.06 $1,128.00 0.11% $169.00 1.70%

Technical Pattern Information

Key: 1S00

Attached File: Stochastic_RSI.py

Associated Function: TECH_PATTERN. L_Stochastic_RSI

Full Indicator Name: Stochastic RSI

Variables it Returns: Stochastic RSI

Explanation: The Stochastic RSI generates signals for overbought or oversold conditions based on the RSI formula, increasing sensitivity to price movements.

Key Combination: 1S00

What is a AI Decision Tree?

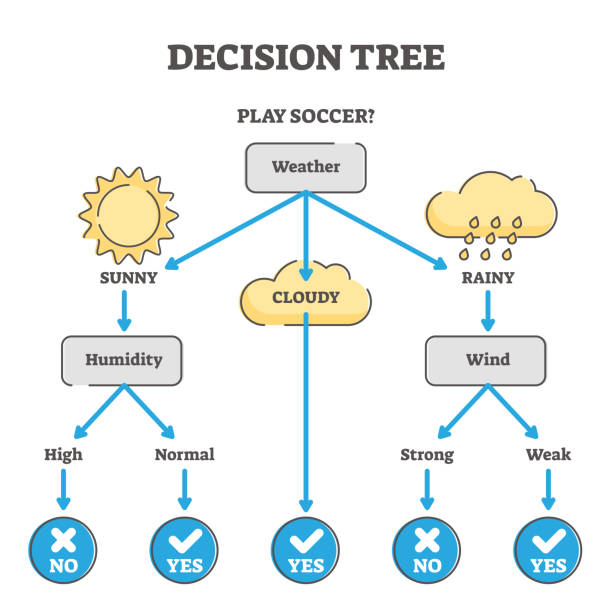
A decision tree is a machine learning algorithm used for classification and regression. In trading, it evaluates various inputs (like technical indicators) to predict outcomes, such as whether to buy or sell. Scikit-learn (sklearn) is a Python library that makes it easy to create and optimize these models.

How Are They Created?

  1. Data Collection: Historical market data (prices, indicators, etc.) is gathered.
  2. Feature Selection: Key metrics like RSI, moving averages, and volatility are chosen as inputs.
  3. Model Training: The decision tree is trained on labeled data, where the algorithm learns patterns that predict price movements.
  4. Optimization: Hyperparameters like tree depth and splitting criteria are tuned for accuracy.

Example of the simplest AI decision tree

How Are They Tested?

  • Backtesting: The trained tree is tested on historical data to measure accuracy.
  • Cross-validation: The data is split into training and testing sets to ensure robustness.
  • Evaluation Metrics: Metrics like precision, recall, and profit factors determine the model's performance. 

Tuisku Trading Strategies Overview

What I See Here

We are going to talk about the attached Pine Script strategy, which serves as an example. The rest of the strategies offered by Tuisku follow a similar structure, except in the decision_tree() function, which is adjusted based on:

  • Technical Patterns
  • Asset Type (e.g., Stock, Crypto)
  • Timeframes (e.g., Daily, Hourly Candles)

You can view the full list of strategies in the "Buy Strategy" tab. This approach results in the wide variety of strategies that Tuisku offers, tailored to different trading styles and market conditions.

Optimization

Tuisku’s AI trains the decision tree on historical market data using Scikit-learn’s DecisionTreeRegressor. This ensures:

  • Data-Driven Decisions: Historical data optimizes thresholds, improving accuracy and adaptability.
    Feature Importance: 
  • Key variables, such as d, rsi1, and smoothK_k, are prioritized based on their predictive power.

You can view the full list of strategies in the "Buy Strategy" tab. This approach results in the wide variety of strategies that Tuisku offers, tailored to different trading styles and market conditions.

Conditions if-else decision tree

The script employs a structured if-else decision tree to evaluate conditions and determine trading actions:

  • Thresholds:  If rsi ≤ 5.85403, the script evaluates finer conditions to decide between "Buy," "Sell," or "Hold."
  • Optimized Thresholds: Unlike traditional strategies, where thresholds like RSI=20 indicate "oversold," Tuisku’s AI optimizes these values for maximum profitability.
  • Depth: The decision tree structure varies in complexity: For high-volume assets, deeper trees (5-8 levels) ensure better decision-making.

Insights

Precision and Safety: By default, strategies aim to minimize risks:

  • Buy Threshold: Set at ret ≥ 0.55 to ensure trades are only initiated under favorable conditions.
  • Stop Loss: Dynamic and automatically placed 2% below the buy point.
  • Sell Threshold: Positions are sold if ret ≤ -0.9, closing unfavorable trades promptly.
  • Risk Management: These settings balance profitability and risk, allowing for confident trading.

Purpose and Outputs

The script evaluates market conditions using technical indicators and calculates a return value (ret) to guide trading actions:

  • Positive ret Values (~1): Indicate a "Buy" signal.
  • Negative ret Values (~-1): Indicate a "Sell" signal.
  • Neutral Zone (-0.7 to 0.7): Values within this range are considered "Hold," meaning no trading action is recommended.

Try the pinescrip strategy, with an AI decision tree optimizing your

  1. Copy the following Code:
  2. Open TradingView.
  3. Once opened, make sure for this text that you have the candles in daily format and that the GOOG stock is on
  4. Go to the Pine Script Editor:
  5. Click the “Pine Script” button at the bottom of the TradingView interface. If the editor isn’t visible, enable it by going to the main menu > "More" > "Pine Script Editor".
  6. Copy the code below and paste it into the editor: